• Zinc Conc. TC 50%min CIF Chinadown(-10)  11-17|Lithium Carbonate 99.2%min Delivered Chinaup(2500)  11-17|Lithium Carbonate 99.5%min Delivered Chinaup(2500)  11-17|Lithium Carbonate 99.5%min CIF Chinaup(0.3)  11-17|Lithium Carbonate 99.5%min Delivered EUup(0.3)  11-17|Lithium Carbonate 99.5%min Delivered USup(0.3)  11-17|Molybdenum Scrap Wire 99.95%min Ex-VAT EXW Chinaup(10)  11-17|Ferro-silicon 75%min Ex-VAT FOB Chinaup(30)  11-17|Ferro-silicon 75%min FOB Chinaup(30)  11-17|Molybdenum Scrap Cutting 99.95%min Ex-VAT EXW Chinaup(10)  11-17|Antimony Ingot 99.65%min EXW Chinaup(4000)  11-17|Sodium Pyroantimonate 58.4% Delivered Chinaup(2000)  11-17|Coal Tar Pitch Coking Value 56%min EXW Chinaup(100)  11-17|Antimony Ingot 99.85%min EXW Chinaup(4000)  11-17
  • Global primary aluminum output down by 2.4% MOM in Nov

    2018-12-24 10:02:45   [Print]
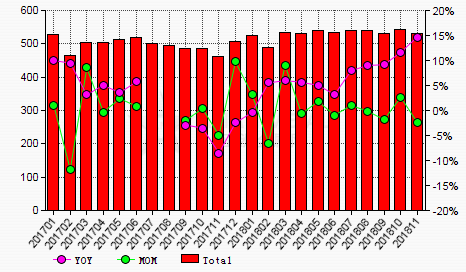
    BEIJING (Asian Metal) 24 Dec 18 - Based on data from International Aluminum Institute, the global primary aluminum output was around 5.Asian Metal Copyright7% YOY.Asian Metal Copyright31 million tonnes in November 2018, down by about 2.Asian Metal Copyright Global primary aluminum output by major regions and month from 12017 to 112018 10kt Statistics on global primary aluminum output by major region Unit: 10kt Region Nov MOM % YOY % China 302.Asian Metal Copyright4% MOM while up by 14.Asian Metal Copyright7% MOM.Asian Metal Copyright7% YOY.Asian Metal Copyright8 -3.Asian Metal Copyright In the first eleven months of 2018, the global primary aluminum output totaled around 58.Asian Metal Copyright42 million tonnes, up by around 6.Asian Metal Copyright42 million tonnes, up by around 6.Asian Metal Copyright2% East Central Europe 33.Asian Metal Copyright9% YOY.

    Global primary aluminum output by month from 1/2017 to 11/2018 (10kt)

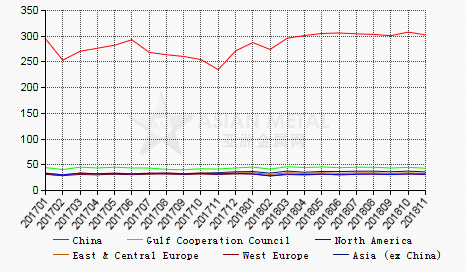
    In November 2018, the primary aluminum output declined in major regions globally. Based on the data, China produced 3.Asian Metal Copyright8 -3.Asian Metal Copyright03 million tonnes of primary aluminum, down by about 1.Asian Metal Copyright42 million tonnes, up by around 6.Asian Metal Copyright7% MOM.Asian Metal Copyright The output in North America declined by about 1.Asian Metal Copyright Gulf Cooperation Council's primary aluminum output decreased by 3.Asian Metal Copyright1 -4.Asian Metal Copyright8% MOM to 433,000 tonnes.Asian Metal Copyright3 -3.Asian Metal Copyright The output in North America declined by about 1.Asian Metal Copyright7% YOY.Asian Metal Copyright5% MOM to around 318,000 tonnes in the month, and that in East and Central Europe decreased by 3.Asian Metal Copyright6 -4.Asian Metal Copyright2% MOM to 332,000 tonnes.

    Global primary aluminum output by major regions and month from 1/2017 to 11/2018 (10kt)

    Statistics on global primary aluminum output by major region (Unit: 10kt)

    Region

    Nov

    MOM (%)

    YOY (%)

    China

    302.5

    -1.7%

    14.7%

    GCC

    43.3

    -3.8%

    3.8%

    North America

    31.8

    -1.5%

    -1.2%

    East & Central Europe

    33.2

    -3.2%

    0%

    West Europe

    30.9

    -3.7%

    -0.6%

    Asia (ex China)

    36.1

    -4.2%

    4%

    Oceanic

    15.6

    -4.9%

    0.6%

    Africa

    13.8

    -3.5%

    0%

    South America

    9

    -3.2%

    -18.2%

    Other

    15

    0.0%

    0.0%

    Total

    531.2

    -2.4%

    6.9%


    .Asian Metal Copyright4% 6Asian Metal Copyright
    Aluminum Ingot 99.7%min In warehouse Gongyi
    Unit:RMB/mt
    Aluminum Ingot 99.7%min In warehouse Gongyi RMB/mt
    China primary aluminum producers' inventory to production ratio statistics by province by month
    Unit: %
      Copyright © Asian Metal Ltd All rights reserved.