NEA: China's installed wind capacity up by 11.2% YoY in 2022
2023-01-18 15:30:59
[Print]
The 2022 national power industry statistics issued by China's National Energy Administration (NEA) indicate that by the end of December, China's installed power capacity totaled about 2,560GW, a year-on-year increase of 7.Asian Metal Copyright Among them, the installed wind capacity is approximately 370GW, up by 11.Asian Metal Copyright8%.Asian Metal Copyright1%, both on a year-on-year basis.Asian Metal Copyright Among them, the installed wind capacity is approximately 370GW, up by 11.Asian Metal Copyright8%.Asian Metal Copyright2%, and the installed solar capacity is about 390GW, up by 28.Asian Metal Copyright Among them, the installed wind capacity is approximately 370GW, up by 11.Asian Metal Copyright1%, both on a year-on-year basis.
.Asian Metal Copyright Among them, the installed wind capacity is approximately 370GW, up by 11Asian Metal Copyright
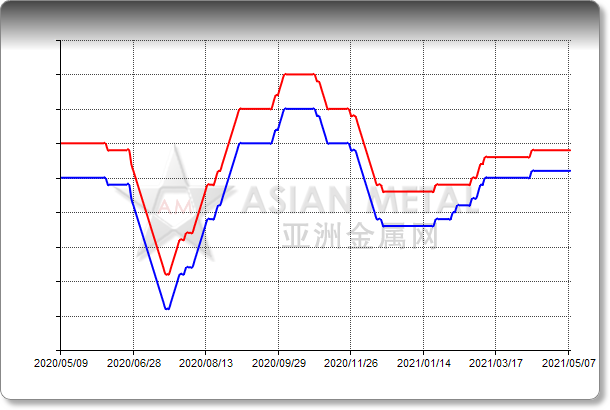
Polysilicon 6N Delivered China
Unit:RMB/kg

China silicon metal producers' operating rate statistics by province by month
Unit: %


